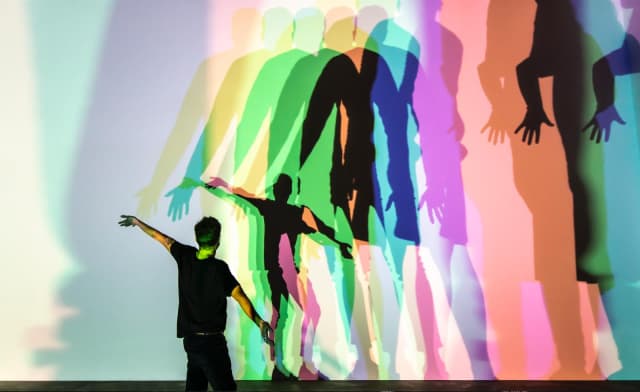
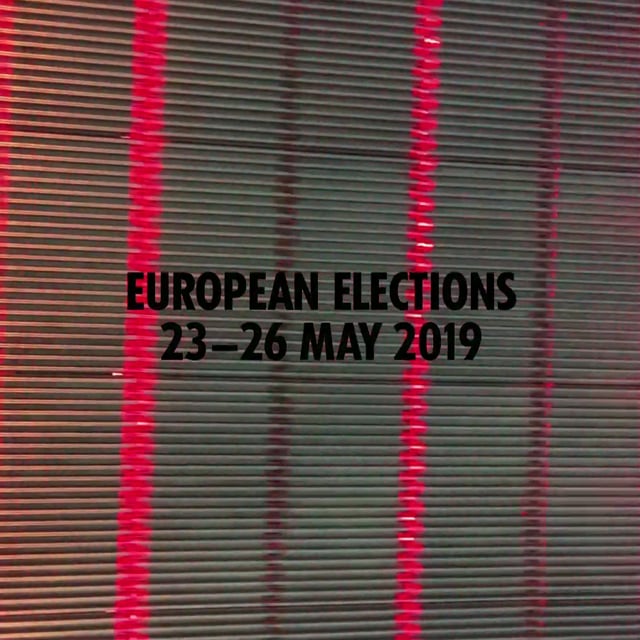
Europeans - be sure to vote in the European Elections! And helpt spread the word: www.votetogether.eu, established by artist Wolfgang Tillmans, is a great resource
In real life, opens 11 July at Tate Modern, London
Job-opening: Assistant to the Head of Design at Studio Olafur Eliasson. Read more here: https://olafureliasson.net/jobs

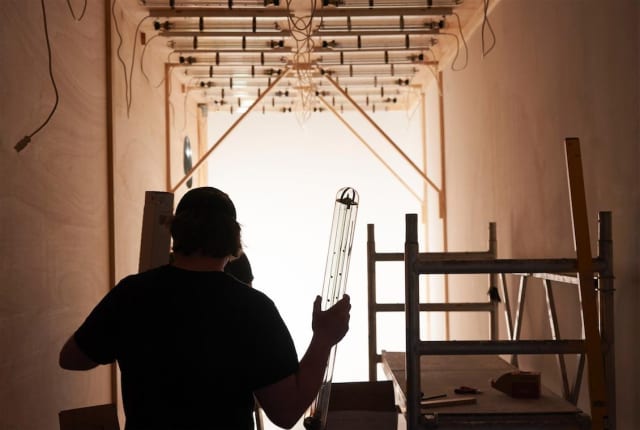
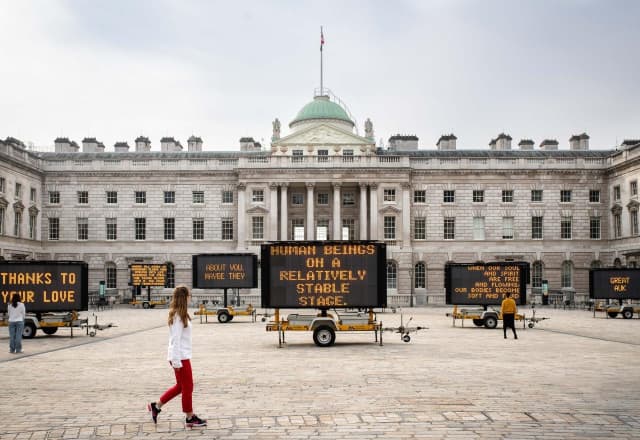
REDUCE SPEED NOW - a new project by artist Justin Brice Guariglia, Somerset House, London
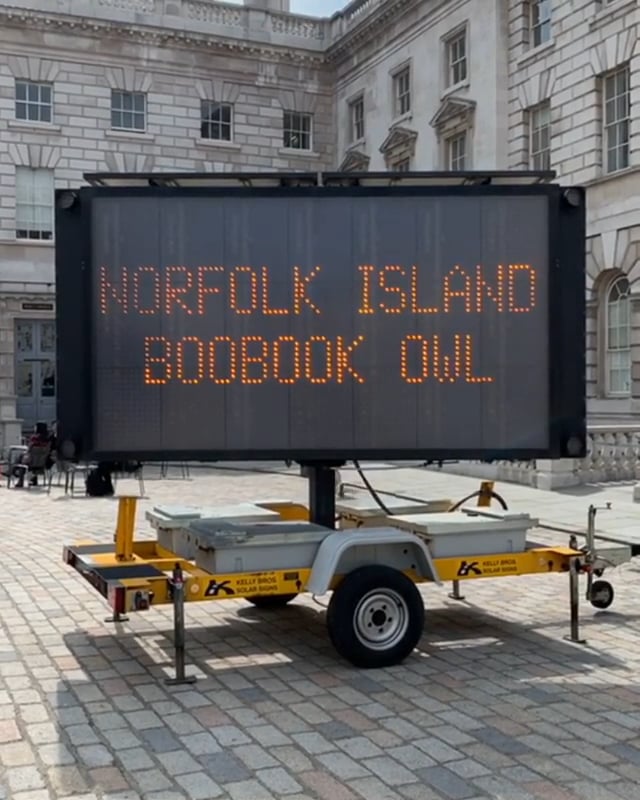
Justin Brice Guariglia - 200 years of fauna extinction, an incomplete list.
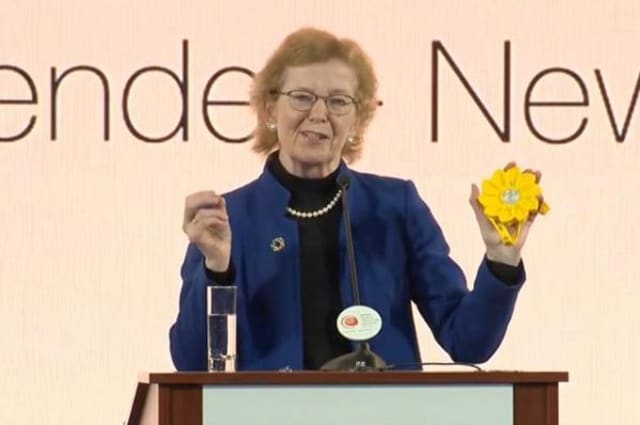
Founded by Nelson Mandela in 2007, The Elders are an independent group of global leaders working together for peace, justice, and human rights, of which Mary Robinson – the first woman president of Ireland – is Chair. Working both publicly and through private diplomacy, The Elders engage with global leaders and civil society at all levels to resolve conflict and address its root causes, to challenge injustice, and to promote ethical leadership and good governance. Earlier this month, Mary Robinson, holding a Little Sun at the podium, participated in the Berlin Energy Transition dialogue and spoke frankly about the role Germany must play in a just transition out of coal for good: ‘Words are not enough. What we need is action: action to drastically cut emissions so temperatures do not rise above the 1.5 degree limit; action to end the use of fossil fuels in domestic markets, and the financing of fossil fuel projects in developing countries by development banks and other financial institutions; and action to deliver a just transition, so that regions and communities previously reliant on fossil fuel production for jobs and broader economic and social structures are not abandoned, that workers’ rights and dignity are respected, and that new opportunities are provided through investment and education for current and future generations.’
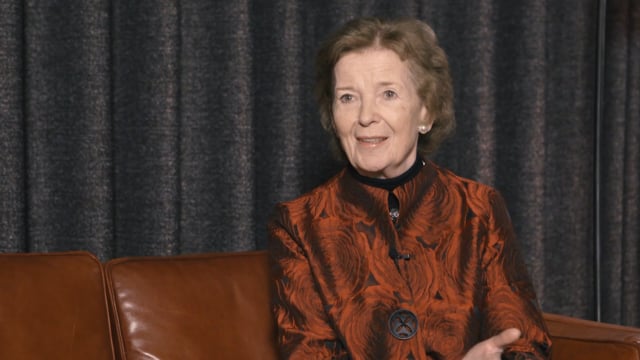
Studio Visits: Mary Robinson – Climate justice is a very people-centred approach to climate change
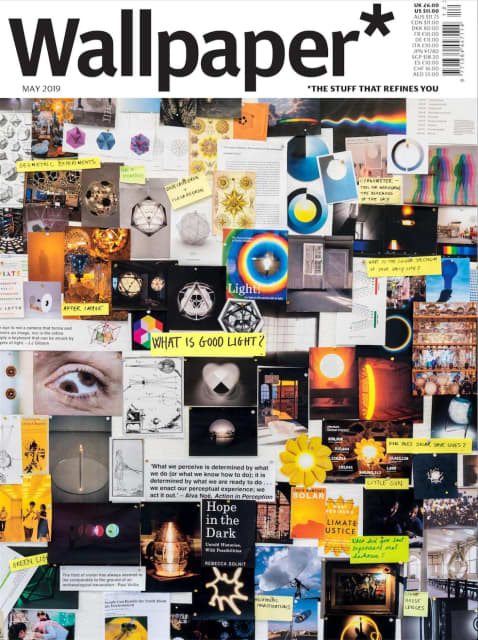
What is good light? Olafur gives his thoughts on the question in the latest issue of Wallpaper.
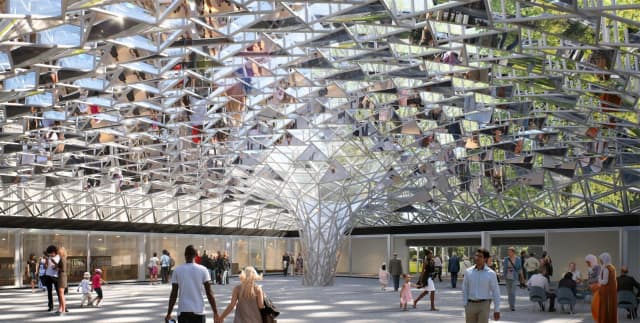
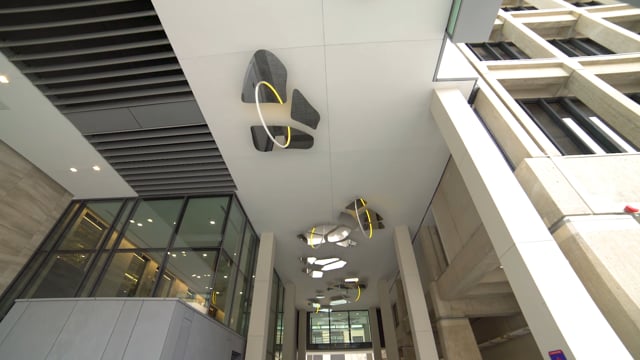
Studio Other Spaces, as a potential part of the reinvention of the Albright-Knox Art Gallery in Buffalo, New York, has designed ‘Common sky’, a sculpture that uses transparent glass and mirror reflections to modulate visitors’ views into the trees of the park. Meanwhile, it generates an ever-changing shadow pattern on the ground. This project would form a new public space connecting the existing Bunshaft Gallery, the surrounding park, and the new master plan and addition designed by OMA
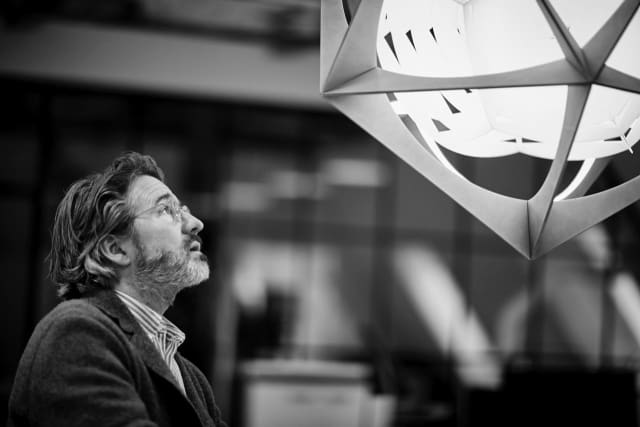
'I'm very excited to bring my longtime interest in geometry and light into this collaboration with Louis Poulsen to create the OE Quasi Light. What distinguishes it from so many lamps is that it shines in towards the core, from which the light is reflected back out onto the surroundings. In one form, the lamp combines precision in design with quality atmospheric lighting.' – Olafur Eliasson
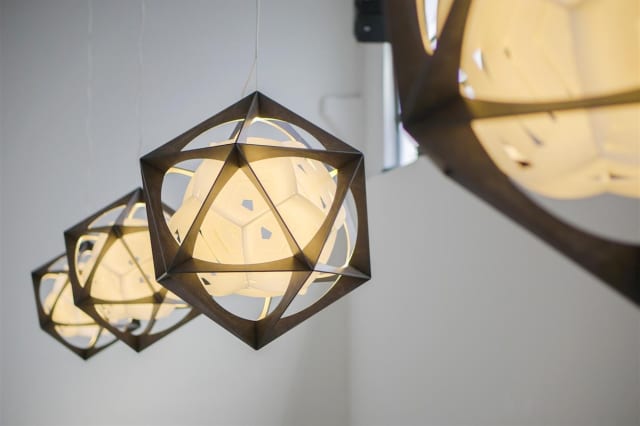
OE Quasi Light – a new lamp designed by Olafur for Louis Poulsen is launching today at Salone del Mobile, Milan. Photo: Fredrik Lindström
Olafur on Northwest Passage at MIT.
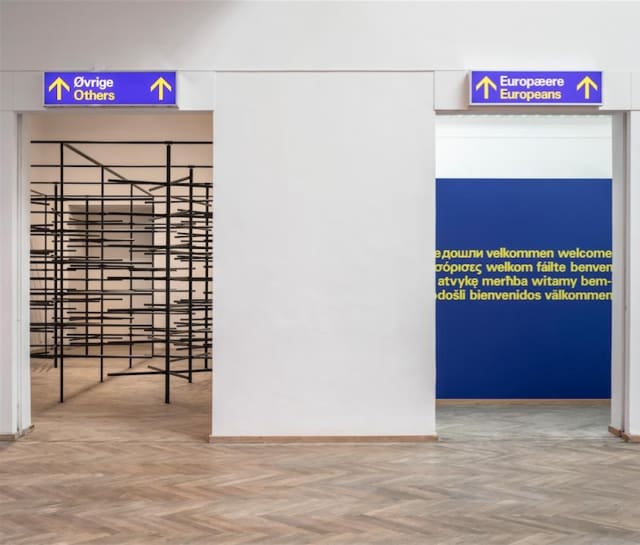
Europa Endlos, Kunsthal Charlottenborg, Copenhagen – part of CPH:DOX. Work by Daniil Galkin, Tourniquet, 2013
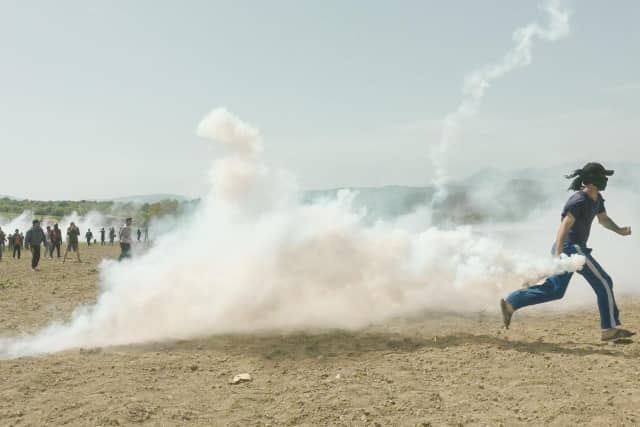
The Rest – a film by Ai Wei Wei, part of the programme at CPH:DOX.
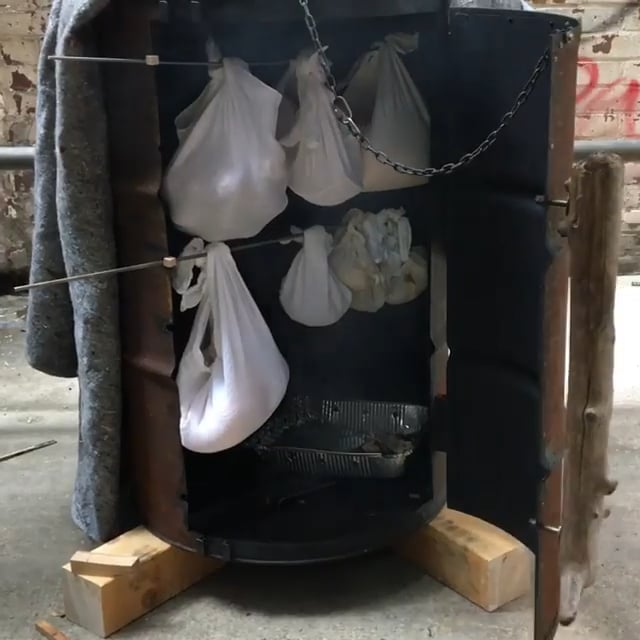
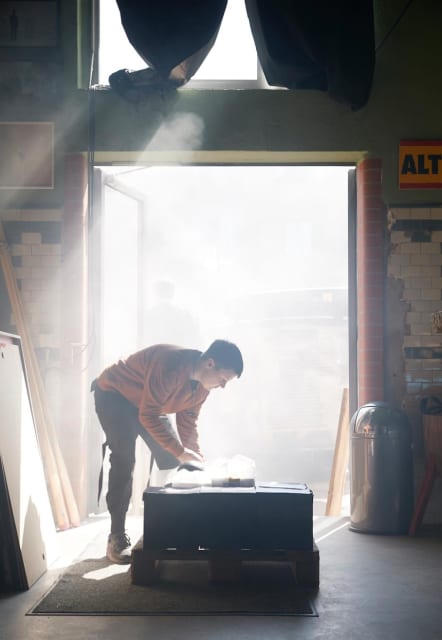
The kitchen has joined forces with the wood shop to work on a series of test tastes, experimenting with different woods and diverse ingredients to create a palette of smoky flavours – check out some of the experiments here: soe_kitchen
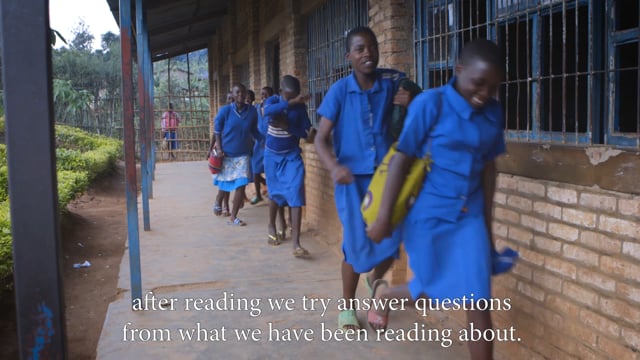
Can you imagine managing your daily tasks without electricity? For school children like Cecile, this is everyday reality. Go to the Little Sun Foundation and make a donation now to empower a new solar generation of school children and teachers in Kamonyi, Rwanda, with portable solar lamps and chargers.

Tidal Museum, designed by our collaborators Studio Other Spaces, is a proposal for a new art museum on the west coast of Denmark, which would be situated between the dunes and the sea. It uses the movement of the tides to shape both the boundaries of the museum and the spaces within it. High tide floods some of the spaces, while at low tide the museum expands into the landscape. Visitors experience a highly flexible building that continually changes depending on the weather, time of day, season, and level of the sea. Visit Studio Other Spaces for more information.

Sourdough reunion: Last year, the kitchen team gave a jar of sourdough starter to everyone in the studio. Now they were asked to bring back a loaf of bread made from that same dough – incredible how the same starting point can yield such diversity. More here: soe_kitchen

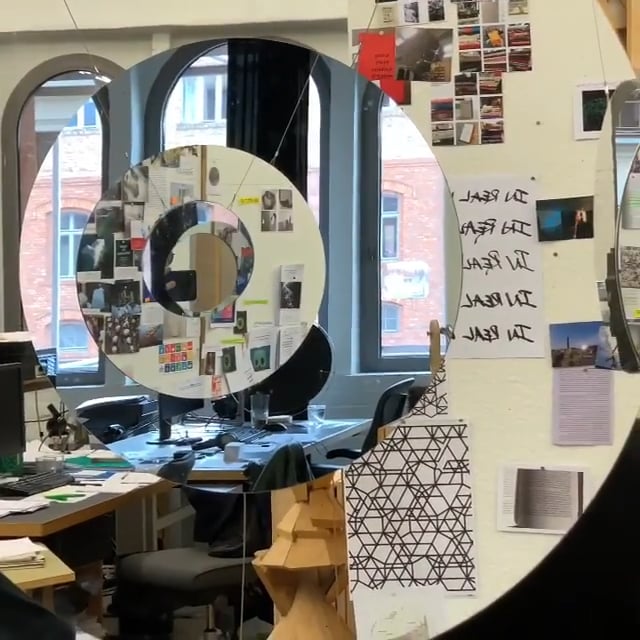
Revisiting and testing 'Eine Beschreibung einer Reflexion, oder aber eine angenehme Übung zu deren Eigenschaften' from 1995. When I moved to Berlin over 20 years ago, this was the work I exhibited at my very first solo exhibition at neugerriemschneider (with whom I still work), and it was also the first exhibition in their space. The work will be part of 'In real life', opening at Tate Modern this summer. via Instagram